Summer temperatures, historical weather data & charts
Posted by Bret B  on October 2, 2014, 7:26 pm on October 2, 2014, 7:26 pm
187.148.175.45
Mark S. asked whether the 2014 summer has been warmer or cooler than normal here in La Manzanilla, and I finally have some data ready for a decent reply. You can read this as far as you like. It gets pretty dense later on; good for the weather nerds anyway.
Super-quick summary:
The summer of 2014 has been warmer than the 10-year average by a few degrees F and will probably end up as the warmest summer overall, based on afternoon maximum temperatures.
Less-quick summary:
I defined "summer" as June-October, which includes most of the heat and almost all of the rain for the year. So all of the 2014 summertime data is still missing the numbers from October. The summertime avg numbers won't change too much when October's numbers get folded in.
Also, in this whole post I am only showing degrees F to keep the data clutter down.
In this summary, I am only analyzing afternoon max temperatures. Below I'll discuss humidity and heat index, and maybe more.
Avg of the afternoon high temps for 2014 only (Jun-Oct): 91.4°F
Avg of the afternoon high temps for 2004-2013 (Jun-Oct): 88.5°F
So the 2014 summer has been 2.9°F hotter than the 10-year avg.
2014 Jun was 4.3°F warmer than the Jun historical avg.
2014 Jul was 4.5°F warmer than the Jul historical avg.
2014 Aug was 3.3°F warmer than the Aug historical avg.
2014 Sep was 1.0°F cooler than the Sep historical avg. (Shows the effect of the 3 storms we had in Sep.)
So you can see the trend, here is a chart from my climate analysis spreadsheet showing each year's summer-only afternoon max temps averaged together:

The thin blue line is the "linear regression" trend line showing what the data would look like if it were simplified down to a straight line.
Keep in mind that the temperature readings took a step up in Sep 2011 when the measuring location moved from Deanna & Darwin's apartments up in the breezes above the church, down to my un-breezy and warmer backyard in the flats near the Jardin. Could be a 2-4 degree F difference on calm hot days(??) Even subtracting this kind of estimated bias out of the data since Sep 2011, I think the 2014 summertime avg would still be a little warmer than the historical avg.
Relative Humidity:
Temperature doesn't tell the whole story about how the summer feels or seems to us. Humidity, breeziness, how much it cools down at night, how active we are, our age and overall health, even our mental "acclimatization" can influence how it feels. I can't measure most of those factors, except for humidity.
Avg of the afternoon minimum RH for 2014 only (Jun-Oct): 62.2%
Avg of the afternoon minimum RH for 2004-2013 (Jun-Oct): 66.7%
The summertime RH chart for the last 10 years:
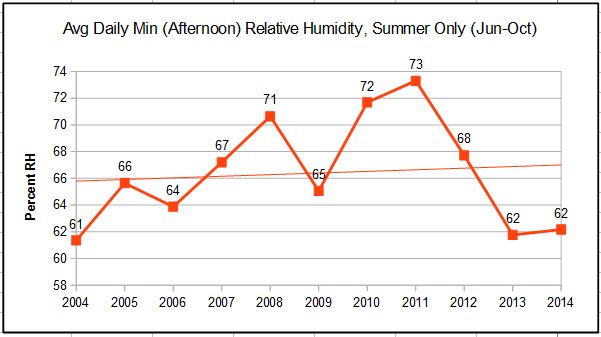
So the humidity was a little less than avg in 2014, but this was mostly because the temperature was higher. "Relative" Humidity is highly dependent on temperature. (See the next section.)
Heat Index:
A much better (but not perfect) factor to use for a good approximation of how a given combination of temperature and RH "feels" is the Heat Index. (See the Wikipedia article for the background of this index and how it is calculated: http://en.wikipedia.org/wiki/Heat_index )
Avg of the afternoon max Heat Index's for 2014 only (Jun-Oct): 104.3°F
Avg of the afternoon max Heat Index's for 2004-2013 (Jun-Oct): 99.7°F
2014 Jun Heat Index was 10.0°F warmer than the Jun historical avg (OUCH!)
2014 Jul Heat Index was 6.5°F warmer than the Jul historical avg.
2014 Aug Heat Index was 3.4°F warmer than the Aug historical avg.
2014 Sep Heat Index was 1.9°F cooler than the Sep historical avg.
The summertime Heat Index chart for the last 10 years:
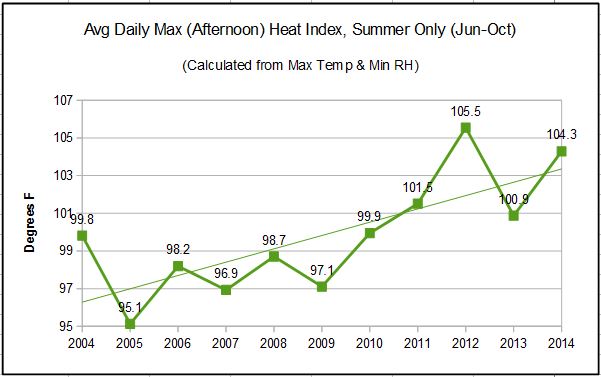
So using temperature or heat index, it looks like the summer of 2014 was warmer than the historical summertime averages, and may even be a record warm summer for La Manzanilla. Only you can add in your personal factors like age, health, activity level, etc.
And Even MORE Charts:
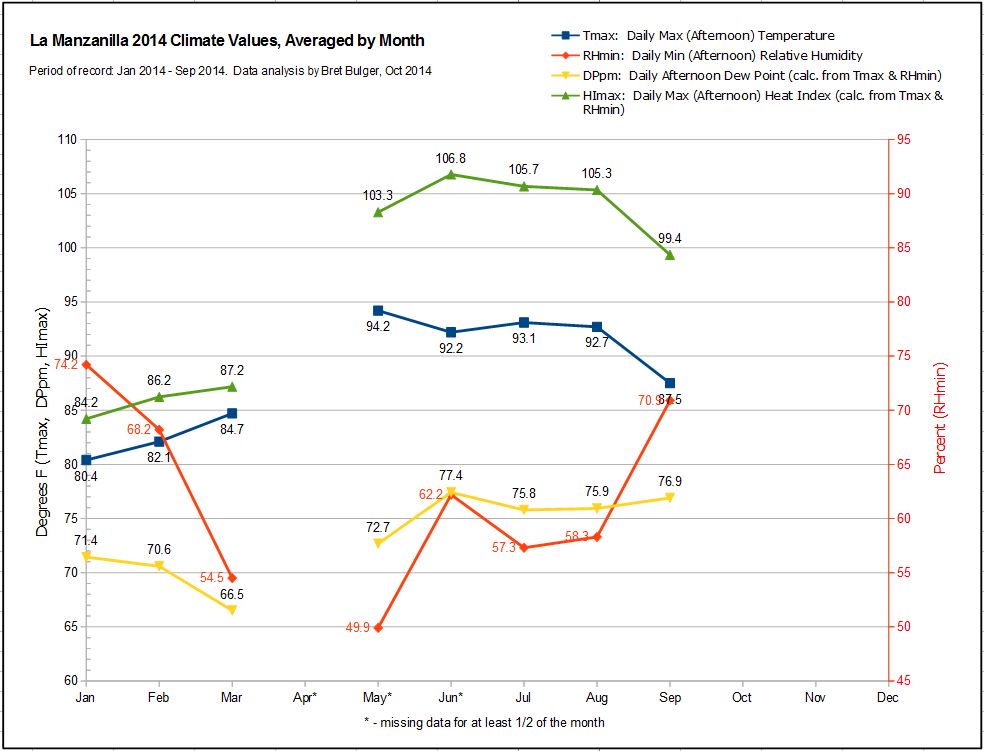
Here is another way to slice the data for 2014. This chart shows the monthly average data for the whole year (of course we still don't have the data for Oct, Nov, Dec yet.) Also, you can see some holes in the data record. I was gone for all of April and parts of May and June and couldn't keep the manual data recording going. (Luckily my rain gauge keeps its data in memory while I'm gone.)
Note that the scale for the RH plot (red) is on the right side. The other 3 plots share the same scale on the left side. Don't worry about the Dew Point plot (yellow.) That's for some other tutorial...)
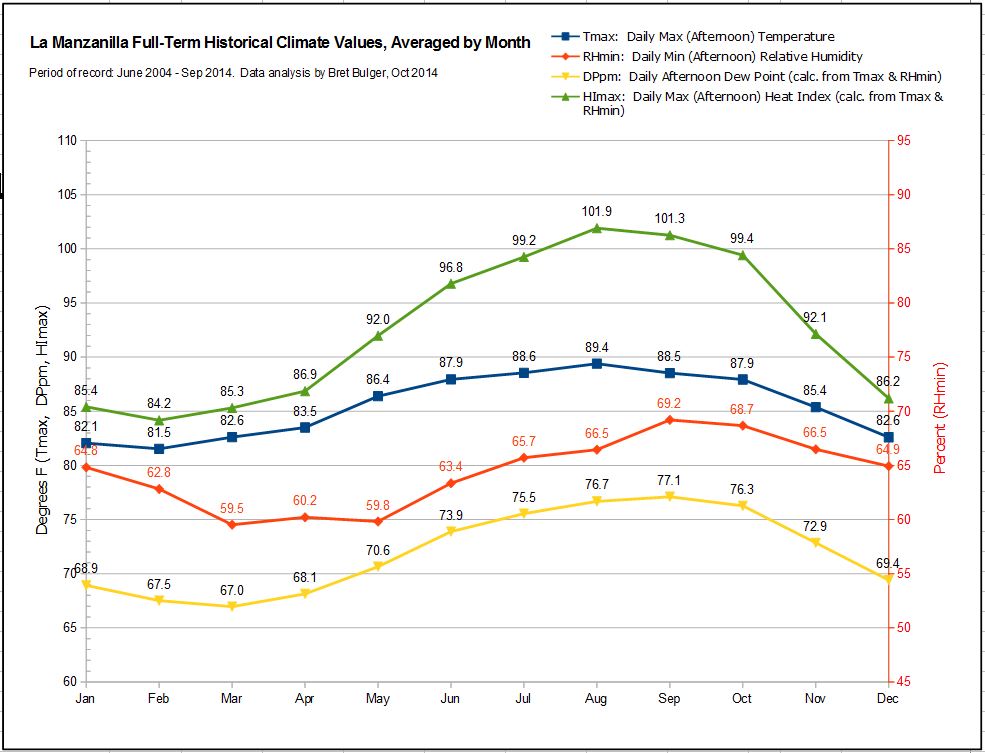
And here is the big one: all the monthly average data for the past 10 years combined together. You can really see how all the plots go up in the summer!
|
-----------------------------Re: Summer temperatures, historical weather data & charts
Posted by Daniel H on October 2, 2014, 8:24 pm, in reply to "Summer temperatures, historical weather data & charts"
187.148.213.140-----------------------------Re: Summer temperatures, historical weather data & charts
Posted by stephanie on October 2, 2014, 8:47 pm, in reply to "Re: Summer temperatures, historical weather data & charts"
75.79.70.16|
Very impressive Bret...thanks for taking the time to do all this work. Makes it a fascinating read for those of us away....see you soon, Stephanie
|
-----------------------------Re: Summer temperatures, historical weather data & charts
Posted by Rob Boyes on October 3, 2014, 12:58 am, in reply to "Re: Summer temperatures, historical weather data & charts"
209.52.53.24|
Yes Ditto I too enjoy keeping up with the goings on , the weather is a big part of being in the tropics (sub tropics?). Thanks Brett and remember , that 50% of anything is above average.
|
-----------------------------Re: Summer temperatures, historical weather data & charts
Posted by Rob Boyes on October 3, 2014, 1:02 am, in reply to "Re: Summer temperatures, historical weather data & charts"
209.52.53.24|
Oh I should have said 51% Sorry
|
-----------------------------Re: Summer temperatures, historical weather data & charts
Posted by Mark S on October 3, 2014, 5:32 am, in reply to "Re: Summer temperatures, historical weather data & charts"
187.146.131.182
Bret, thank you very much for your complete analysis. It is so interesting, but I'm a liar, er lawyer, and have difficulty with scientific charts. (I always hire expert witnesses for these sorts of things).
But, I did get the answer to my question. It does appear that this summer is a little warmer than the norm.
As you serve our entire community out of the goodness of your heart, I'll be more that happy to pay for your favorite beverage anytime you wander south to Pedro's.
|
-----------------------------
|
|
|
|
|
|

