Rain report for 2014
Posted by Bret B  on October 17, 2014, 5:25 pm on October 17, 2014, 5:25 pm
187.148.142.164
Now that we are back to summer-like heat indices again (the HI has been getting up to 106°F/41°C lately,) here are more rain statistics to trigger fond memories of the cooling rains last month!
This data will be updated at the end of the year; for now it only includes Jan-Sep. And sorry, but the charts are only in inches.
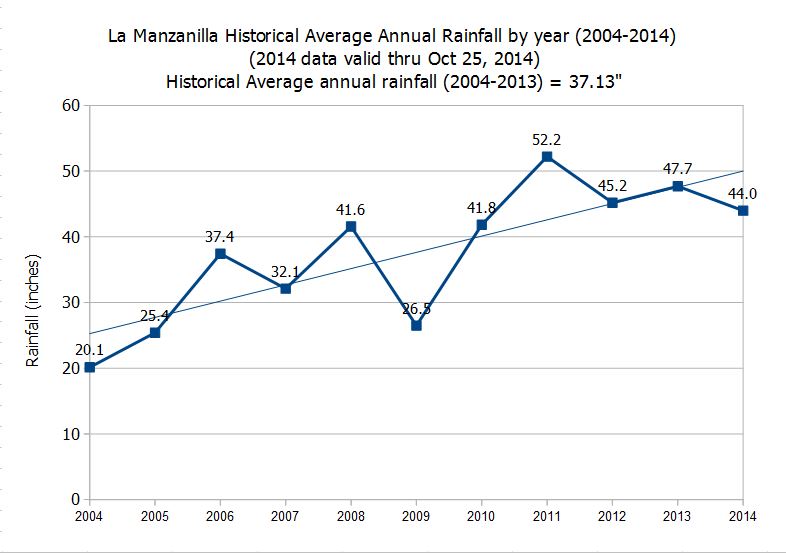
First the annuals: the historical avg annual rainfall (2004-2013) is 37.13"/943mm. 2014 has had 40.56"/1030mm (thru Sep 30th).
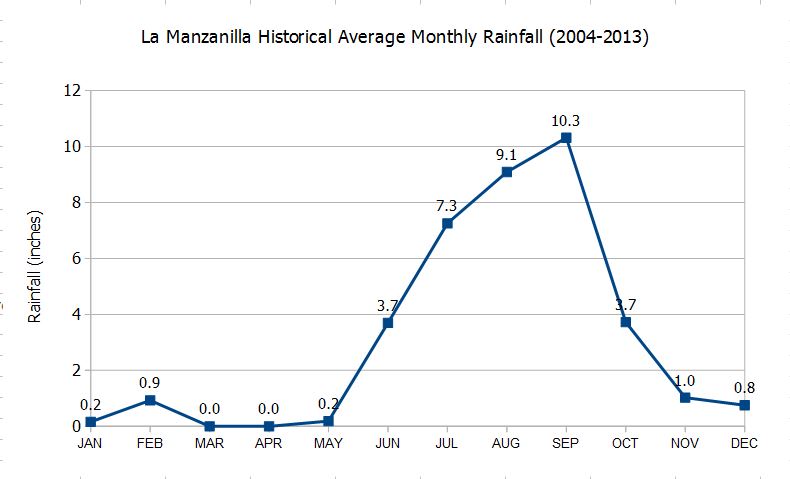
Historical Average Monthly Rainfall:
You can see the most of the rain falls from Jun-Oct. Interesting rain bump in February.
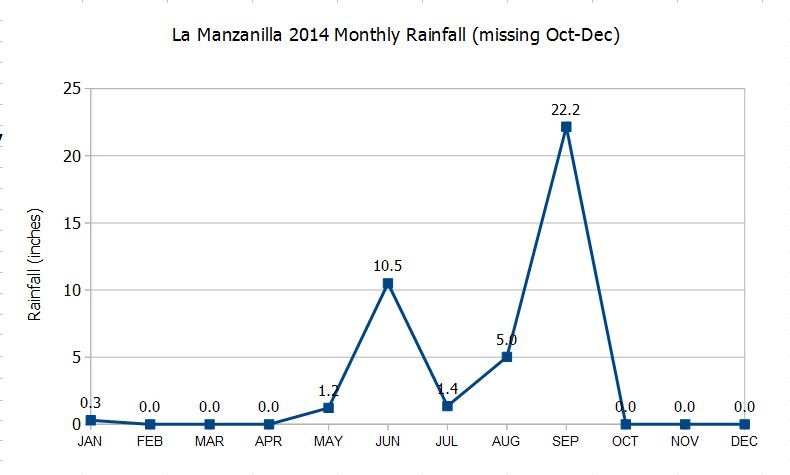
2014 Monthly Rainfall:
We had a wetter-then-normal June, drier July and August, then had the all-time wettest month on record in September.
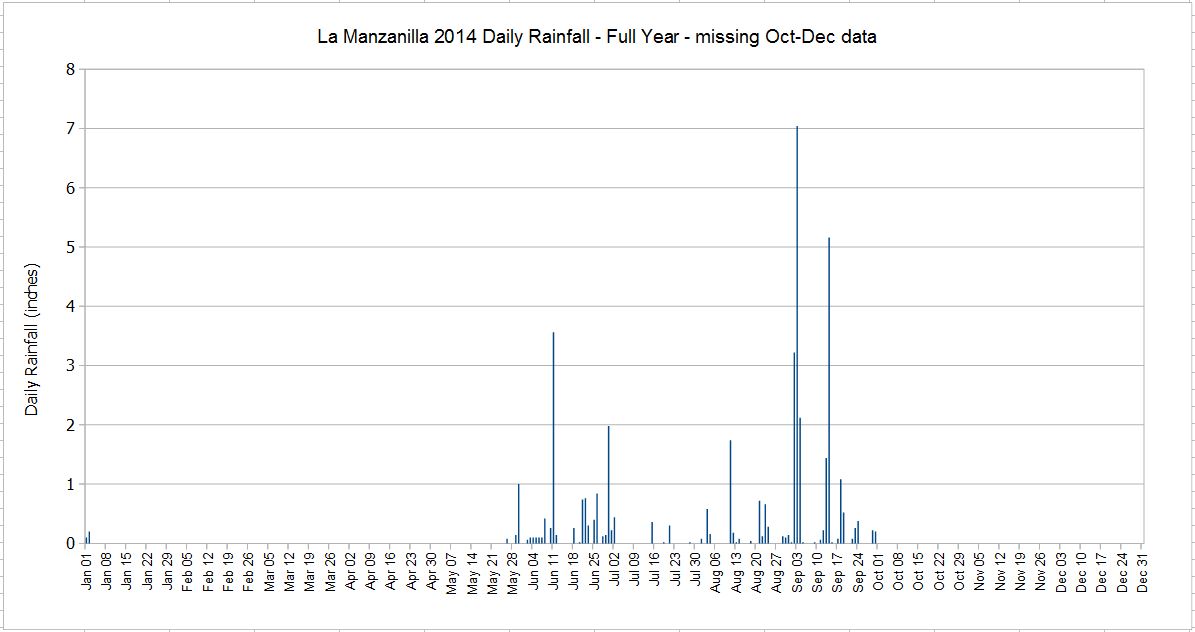
2014 Daily Rainfall, Full Year:
You can really see that the rainfall was very irregular.
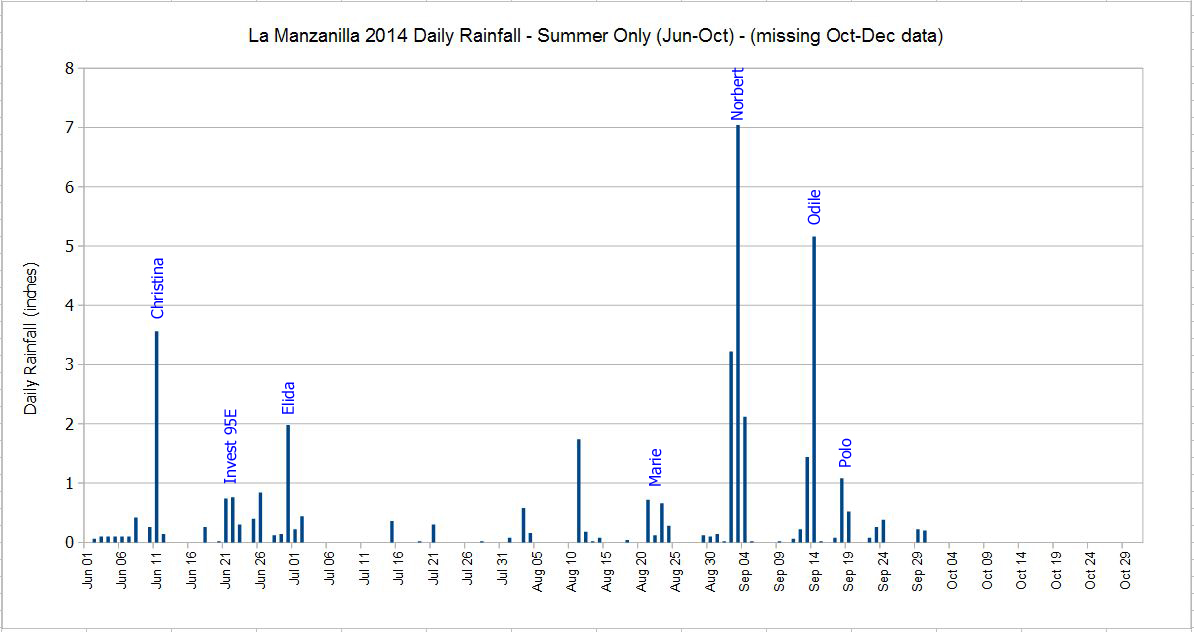
2014 Daily Rain, Summer Only:
I've added the storm names that gave us any significant rain. Unnamed rains were from nameless thunderstorms. It's obvious that most of our rain comes from named storms. Too bad we couldn't spread the rain out a little better...
Hopefully we can get some cooling rain from Invest 92E soon. Enjoy!
|
-----------------------------Re: Rain report for 2014
Posted by jon pace on October 18, 2014, 12:59 am, in reply to "Rain report for 2014"|
Thank you Bret for the extensive and well-produced/ designed information. It certainly would have been better if the rain had been distributed more evenly over the "rainy" season.
|
-----------------------------Re: Rain report for 2014
Posted by Lynne on October 18, 2014, 10:40 am, in reply to "Re: Rain report for 2014"|
On the other hand, we were only stuck inside for two days in September--the 4th and the 14th, which is how I like it. No cabin fever! ;-)
|
-----------------------------Re: Rain report for 2014
Posted by David Dagoli on October 18, 2014, 11:08 am, in reply to "Re: Rain report for 2014"
174.7.134.46|
Wow, cool graphs! Love it! Bien Hecho!
|
-----------------------------1 more rain chart: yearly rainfall trend
Posted by Bret B on October 25, 2014, 5:53 pm, in reply to "Re: Rain report for 2014"
187.148.142.164
This was a suggestion of Lisa's. Here is the annual rainfall by year, showing the definite upward trend in rainfall for the last 10 years. (The 2014 data is valid as of today, and might go up some more by the end of the year.)
|
-----------------------------Re: 1 more rain chart: yearly rainfall trend
Posted by Erin on October 25, 2014, 6:03 pm, in reply to "1 more rain chart: yearly rainfall trend"
96.54.244.169|
Great job Bret, kudos to your presentations and obvious data collection, it takes dedication to keep with it. I am particularly interested in the year by year comparison, some years you think it is raining a lot but really you have nothing concrete to compare it with, now we do.....I hope all the rain means the aquifers are filling up and that we will have lots in reserve for later in the winter and spring. One thing is for sure, I know what we will see in November upon our return, GREEN
|
-----------------------------Re: 1 more rain chart: yearly rainfall trend
Posted by Pablo on October 26, 2014, 8:52 am, in reply to "Re: 1 more rain chart: yearly rainfall trend"
96.50.109.80
Great stuff, Bret. I mean, who doesn't like a good chart or two to look at with their bowl of Shreddies in the morning? I've put them in my LM file for future reference. Enjoy reading all your posts on weather and applaud your perspicacity (finally a chance to use this big word!!). For those of you reaching for your Funk and Wagnall's (the other old folks out there will know that reference), errr... I mean clicking on their Wickapedia link, I offer this example:
"If you devote long hours to the arts of attention and analysis, you might develop the perspicacity required to become a really good detective."
|
-----------------------------
|
|
|
|
|
|
|