Posted by Daniel H
![]()
 on August 3, 2015, 7:22 pm, in reply to "Mexican Peso Crisis?"
201.133.163.5
The article David linked to came out July 29th, left side of the graph below
with now on the right side.
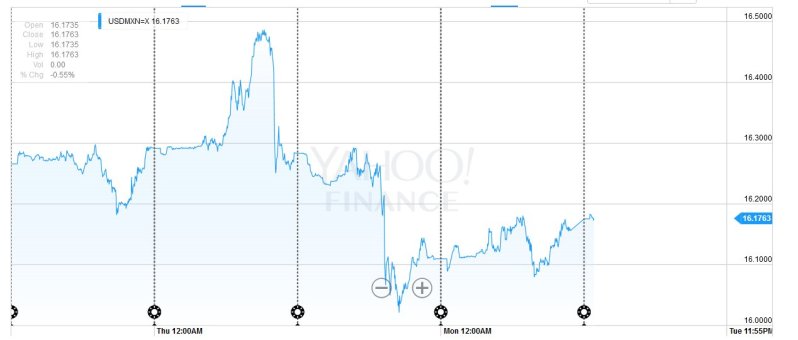
There is a .4 difference between the tip of the F you finger and this morning,
someone made a lot of money off scared people dumping pesos.
Here is a graph from 2006 to now.
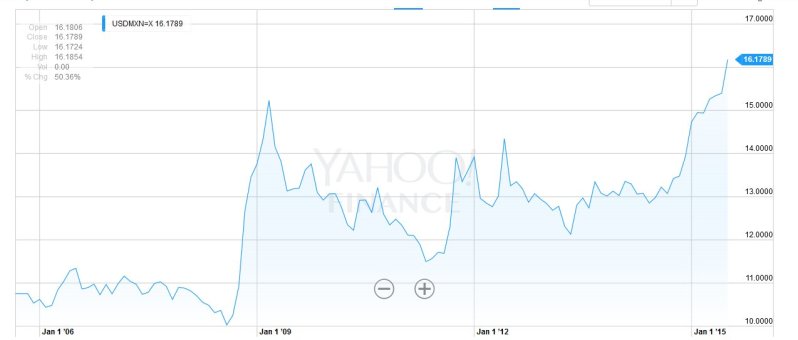
Remember March 09 (the high point left of center) when the peso was losing
value very quickly? You can use Google to search for news articles from
that period of time and read similar things as we are reading now.
https://www.google.com.mx/search?q=mexico+peso&biw=1310&bih=590&source=lnt&tbs=cdr%3A1%2Ccd_min%3A12%2F9%2F2008%2Ccd_max%3A4%2F7%2F2009&tbm=
Every time the graph goes up or down someone just made money off the difference.
Banks ---------- everyone else

262
Message Thread
![]()
« Back to index | View thread »